The most complained-about cars, 2010-2025
Q3 2026 edition. Owner complaints filed with the federal regulator, counted from NHTSA's own bulk file, one complaint per vehicle, with the part owners named most beside each. Reports filed, never failure rates, and the whole method is on this page.
By Iqbal Taher for Oil & Miles. Published September 14, 2026. Data: NHTSA FLAT_CMPL bulk file dated 2026-08-25. Next edition: Q4 2026, December 2026.
The Q3 2026 edition, kept at this address for citation. The latest edition is always at oilandmiles.com/reports/most-complained-cars.
- 626,070complaints
- 4,091vehicles
- 2010-2025model years
- 2026-08-25file dated
- Q3 2026edition
Key findings
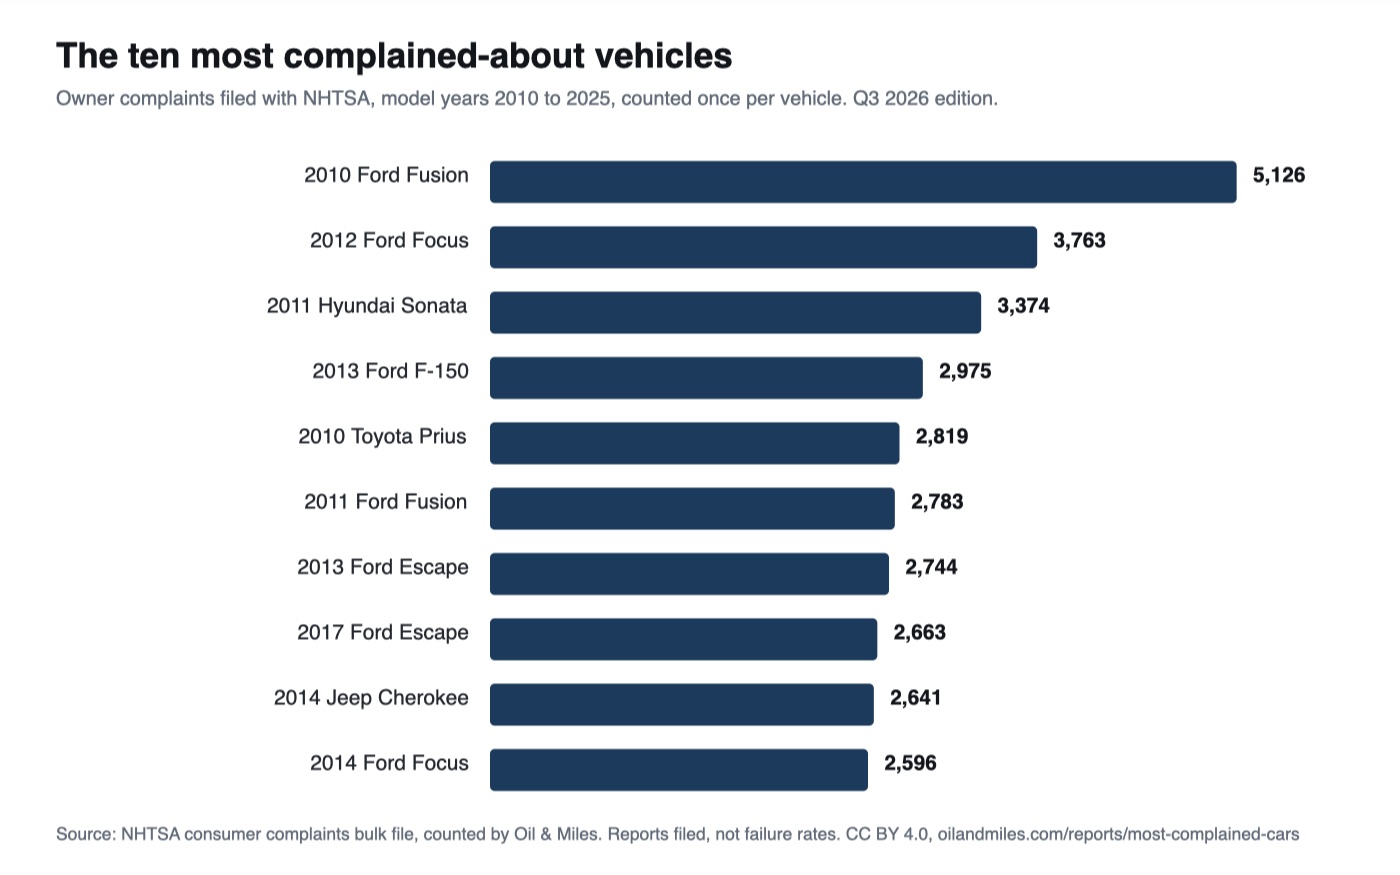
- The 2010 Ford Fusion has the most complaints of any vehicle from model years 2010-2025: 5,126, with steering named most (1,640 of them).
- Ford holds 17 of the 25 most complained-about vehicles, and 45 of the top 100.
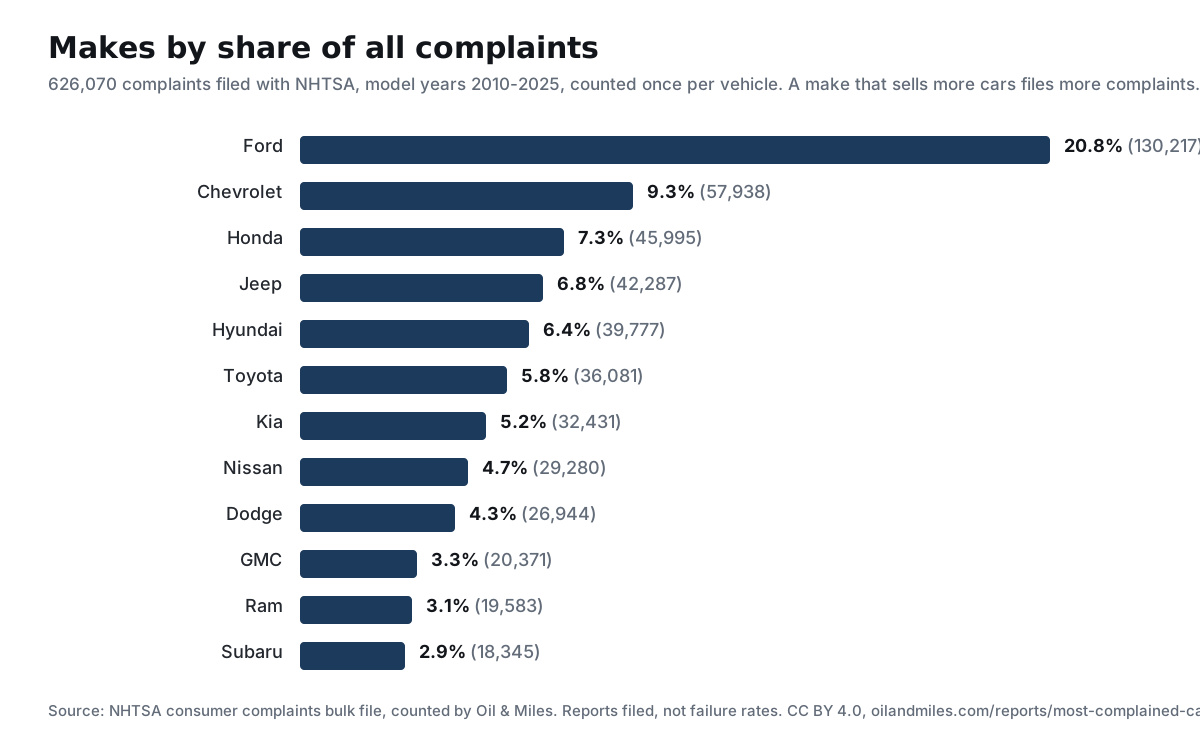
- Ford accounts for 20.8% of all 626,070 complaints in the file; Chevrolet is next at 9.3%.
- Power train is the component named most in 9 of the top 25 vehicles; steering in 6.
- The only vehicle from model year 2023 or newer in the top 100 is the 2023 Tesla Model Y, with 1,134 complaints.
Download the data
Free to use under CC BY 4.0: credit Oil & Miles and link to this page. Journalists get answers on the method the same day through the contact page.
- JSONmost-complained-2026-q3.jsonThe top 100, one object per vehicle: rank, make, model, model year, complaints, the component named most, 22 KB
- CSVnhtsa-complaints-by-model-2010-2025.csvEvery vehicle and component in the file, model years 2010-2025, one row per make, model, model year and component, 1.0 MB
- SVGmost-complained-2026-q3.svgFigure 1, the top-ten chart, vector, embeds anywhere, 4 KB
- SVGmost-complained-2026-q3-makes.svgFigure 2, makes by share of all complaints, 6 KB
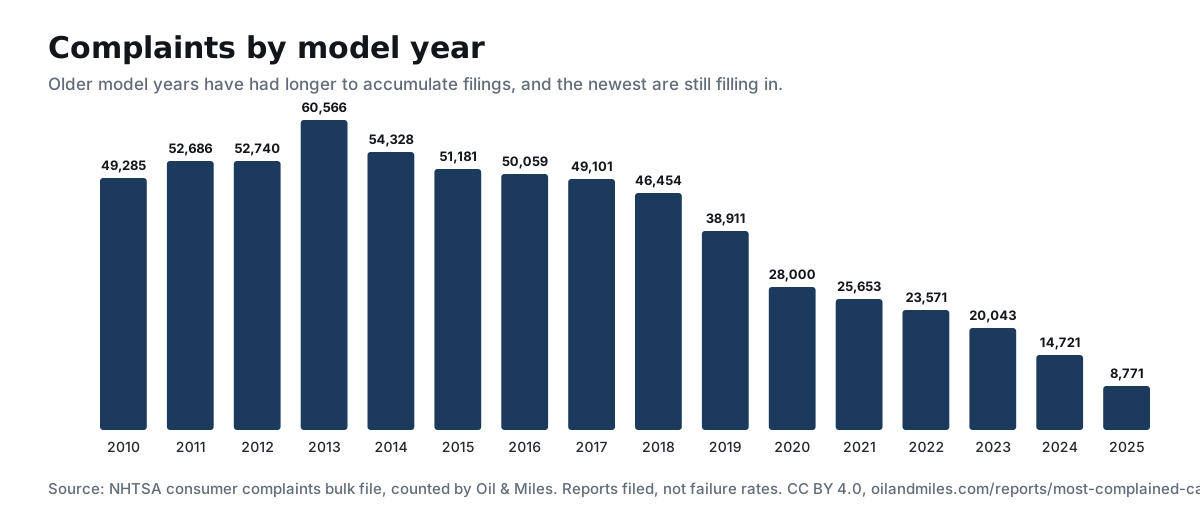
- SVGmost-complained-2026-q3-years.svgFigure 3, complaints by model year, 7 KB
- PDFmost-complained-cars-2026-q3.pdfThe whole report as printed, Q3 2026 edition
- JPGmost-complained-2026-q3.jpgThe same chart at 1200 px, for print and slides, 125 KB
Cite Oil & Miles (2026). The most complained-about cars, model years 2010-2025: Q3 2026 edition. https://oilandmiles.com/reports/most-complained-cars
APA Oil & Miles. (2026). The most complained-about cars, model years 2010-2025 (Q3 2026 ed.) [Data report]. https://oilandmiles.com/reports/most-complained-cars
For journalists. Free to use with credit; the charts come as SVG and can be re-rendered at any size on request; questions about the method are answered the same day through the contact page, ask for Iqbal Taher.
In numbers. 626,070 complaints across 4,091 vehicles, model years 2010-2025. The 2010 Ford Fusion leads with 5,126, steering named most (1,640), and 21 of every hundred complaints name a Ford.
Ford holds eight of the twelve most complained-about vehicles here, and two faults account for five of them: steering on the 2010, 2011 and 2012 Fusion, power train on the 2012 and 2014 Focus. One make with two well-documented problems, in the years it sold the most cars, is most of a table like this.
These are counts of reports, not rates of failure. A car that sold in huge numbers, or drew a recall and a news cycle, collects more filings than a rare car with a worse record.
The repeats matter more than the ranking. The Escape appears twice, 2013 and 2017, engine named most both times; the 2017 drew fewer complaints overall but more about the engine, 1,555 against 1,264, the opposite of a fault being fixed.
The Tesla Model Y repeats too, 2021 and 2023, and what its owners name is forward collision avoidance and adaptive cruise control, a category the oldest cars in this file didn't have. One bad year can be luck; the same model naming the same part two generations apart is the file telling you something.
The 25 vehicles with the most complaints
Complaints filed with NHTSA per vehicle, model years 2010-2025, and the component named in the most of them. "Again in" marks the same model returning in another model year, in the top 100, with the same component named most. Counts of reports, not rates.
| # | Vehicle | Complaints | Named most |
|---|---|---|---|
| 1 | 2010 Ford Fusion | 5,126 | Steering (1,640) again in 2011, 2012, 2014 |
| 2 | 2012 Ford Focus | 3,763 | Power train (1,385) again in 2013, 2014, 2015, 2016 |
| 3 | 2011 Hyundai Sonata | 3,374 | Steering (1,164) |
| 4 | 2013 Ford F-150 | 2,975 | Power train (1,307) again in 2011, 2012, 2014, 2015, 2016, 2017, 2018, 2019, 2021 |
| 5 | 2010 Toyota Prius | 2,819 | Service brakes, hydraulic (751) |
| 6 | 2011 Ford Fusion | 2,783 | Steering (1,403) again in 2010, 2012, 2014 |
| 7 | 2013 Ford Escape | 2,744 | Engine (1,264) again in 2014, 2017, 2018 |
| 8 | 2017 Ford Escape | 2,663 | Engine (1,555) again in 2013, 2014, 2018 |
| 9 | 2014 Jeep Cherokee | 2,641 | Power train (1,448) again in 2015, 2016, 2017, 2019 |
| 10 | 2014 Ford Focus | 2,596 | Power train (1,491) again in 2012, 2013, 2015, 2016 |
| 11 | 2018 Ram 2500 | 2,547 | Service brakes (1,817) |
| 12 | 2012 Ford Fusion | 2,513 | Steering (1,439) again in 2010, 2011, 2014 |
| 13 | 2016 Ford Explorer | 2,441 | Steering (502) again in 2011, 2013, 2014, 2015 |
| 14 | 2013 Ford Edge | 2,439 | Electrical system (851) again in 2011, 2012 |
| 15 | 2014 Jeep Grand Cherokee | 2,373 | Power train (467) again in 2015 |
| 16 | 2013 Nissan Altima | 2,308 | Air bags (512) |
| 17 | 2018 Ford F-150 | 2,273 | Power train (970) again in 2011, 2012, 2013, 2014, 2015, 2016, 2017, 2019, 2021 |
| 18 | 2013 Ford Explorer | 2,230 | Steering (808) again in 2011, 2014, 2015, 2016 |
| 19 | 2011 Ford F-150 | 2,186 | Power train (810) again in 2012, 2013, 2014, 2015, 2016, 2017, 2018, 2019, 2021 |
| 20 | 2018 Honda CR-V | 2,122 | Engine (524) again in 2017 |
| 21 | 2013 Ford Focus | 2,106 | Power train (1,051) again in 2012, 2014, 2015, 2016 |
| 22 | 2014 Ford Escape | 2,075 | Engine (719) again in 2013, 2017, 2018 |
| 23 | 2010 Ford Escape | 2,068 | Vehicle speed control (557) |
| 24 | 2016 Ford F-150 | 2,023 | Power train (552) again in 2011, 2012, 2013, 2014, 2015, 2017, 2018, 2019, 2021 |
| 25 | 2015 Chrysler 200 | 1,983 | Electrical system (746) |
Source: NHTSA consumer complaints bulk file dated 2026-08-25, counted once per vehicle by Oil & Miles. Counts of reports, not rates.
Show the full top 100
| # | Vehicle | Complaints | Named most |
|---|---|---|---|
| 1 | 2010 Ford Fusion | 5,126 | Steering (1,640) |
| 2 | 2012 Ford Focus | 3,763 | Power train (1,385) |
| 3 | 2011 Hyundai Sonata | 3,374 | Steering (1,164) |
| 4 | 2013 Ford F-150 | 2,975 | Power train (1,307) |
| 5 | 2010 Toyota Prius | 2,819 | Service brakes, hydraulic (751) |
| 6 | 2011 Ford Fusion | 2,783 | Steering (1,403) |
| 7 | 2013 Ford Escape | 2,744 | Engine (1,264) |
| 8 | 2017 Ford Escape | 2,663 | Engine (1,555) |
| 9 | 2014 Jeep Cherokee | 2,641 | Power train (1,448) |
| 10 | 2014 Ford Focus | 2,596 | Power train (1,491) |
| 11 | 2018 Ram 2500 | 2,547 | Service brakes (1,817) |
| 12 | 2012 Ford Fusion | 2,513 | Steering (1,439) |
| 13 | 2016 Ford Explorer | 2,441 | Steering (502) |
| 14 | 2013 Ford Edge | 2,439 | Electrical system (851) |
| 15 | 2014 Jeep Grand Cherokee | 2,373 | Power train (467) |
| 16 | 2013 Nissan Altima | 2,308 | Air bags (512) |
| 17 | 2018 Ford F-150 | 2,273 | Power train (970) |
| 18 | 2013 Ford Explorer | 2,230 | Steering (808) |
| 19 | 2011 Ford F-150 | 2,186 | Power train (810) |
| 20 | 2018 Honda CR-V | 2,122 | Engine (524) |
| 21 | 2013 Ford Focus | 2,106 | Power train (1,051) |
| 22 | 2014 Ford Escape | 2,075 | Engine (719) |
| 23 | 2010 Ford Escape | 2,068 | Vehicle speed control (557) |
| 24 | 2016 Ford F-150 | 2,023 | Power train (552) |
| 25 | 2015 Chrysler 200 | 1,983 | Electrical system (746) |
| 26 | 2013 Hyundai Sonata | 1,903 | Engine (730) |
| 27 | 2018 Honda Accord | 1,853 | Engine (537) |
| 28 | 2018 Jeep Wrangler | 1,806 | Steering (1,112) |
| 29 | 2011 Ford Edge | 1,801 | Electrical system (683) |
| 30 | 2013 Ford Fusion | 1,785 | Engine (382) |
| 31 | 2015 Jeep Cherokee | 1,784 | Power train (992) |
| 32 | 2012 Ford F-150 | 1,777 | Power train (669) |
| 33 | 2018 Ford Escape | 1,770 | Engine (1,128) |
| 34 | 2015 Ford Explorer | 1,770 | Steering (336) |
| 35 | 2017 Honda CR-V | 1,756 | Engine (527) |
| 36 | 2014 Ram 1500 | 1,750 | Steering (487) |
| 37 | 2016 Honda Pilot | 1,685 | Engine (758) |
| 38 | 2015 Ford F-150 | 1,683 | Power train (381) |
| 39 | 2017 Ford Explorer | 1,677 | Structure (367) |
| 40 | 2014 Ford Explorer | 1,673 | Steering (483) |
| 41 | 2011 Jeep Grand Cherokee | 1,639 | Electrical system (760) |
| 42 | 2012 Jeep Grand Cherokee | 1,638 | Electrical system (802) |
| 43 | 2016 Hyundai Tucson | 1,616 | Power train (513) |
| 44 | 2019 Jeep Cherokee | 1,615 | Power train (771) |
| 45 | 2016 Ford Fusion | 1,608 | Engine (439) |
| 46 | 2020 Ford Escape | 1,582 | Structure, body (493) |
| 47 | 2010 Chrysler Town AND Country | 1,556 | Electrical system (960) |
| 48 | 2012 Hyundai Sonata | 1,556 | Engine (567) |
| 49 | 2016 Ram 1500 | 1,526 | Steering (304) |
| 50 | 2014 Ford F-150 | 1,520 | Power train (410) |
| 51 | 2011 Kia Sorento | 1,517 | Engine (284) |
| 52 | 2017 Chrysler Pacifica | 1,499 | Engine (520) |
| 53 | 2019 Ram 1500 | 1,463 | Electrical system (366) |
| 54 | 2015 Ram 1500 | 1,436 | Steering (336) |
| 55 | 2014 Chevrolet Silverado 1500 | 1,433 | Steering (400) |
| 56 | 2013 Honda Accord | 1,418 | Steering (493) |
| 57 | 2017 Ford F-150 | 1,414 | Power train (519) |
| 58 | 2016 Jeep Cherokee | 1,403 | Power train (617) |
| 59 | 2013 Kia Optima | 1,379 | Engine (612) |
| 60 | 2010 Chevrolet Malibu | 1,359 | Steering (449) |
| 61 | 2015 Jeep Grand Cherokee | 1,354 | Power train (346) |
| 62 | 2017 Jeep Cherokee | 1,328 | Power train (640) |
| 63 | 2014 Ford Fusion | 1,324 | Steering (317) |
| 64 | 2011 Ford Escape | 1,316 | Steering (406) |
| 65 | 2017 Ford Edge | 1,313 | Engine (657) |
| 66 | 2013 Hyundai Elantra | 1,311 | Steering (269) |
| 67 | 2019 Ford F-150 | 1,309 | Power train (707) |
| 68 | 2013 Ram 1500 | 1,263 | Steering (618) |
| 69 | 2016 Kia Sorento | 1,244 | Engine (690) |
| 70 | 2010 Toyota Corolla | 1,244 | Air bags (419) |
| 71 | 2011 Ford Explorer | 1,195 | Steering (727) |
| 72 | 2020 Ford Explorer | 1,194 | Power train (461) |
| 73 | 2016 Ford Focus | 1,178 | Power train (622) |
| 74 | 2019 Ford F-250 SD | 1,161 | Steering (771) |
| 75 | 2017 Ford F-250 SD | 1,155 | Steering (715) |
| 76 | 2015 Hyundai Sonata | 1,139 | Engine (618) |
| 77 | 2023 Tesla Model Y | 1,134 | Forward collision avoidance, adaptive cruise control (299) |
| 78 | 2012 Ford Edge | 1,132 | Electrical system (459) |
| 79 | 2014 Nissan Altima | 1,113 | Exterior lighting (279) |
| 80 | 2017 Ford Fusion | 1,103 | Engine (391) |
| 81 | 2015 Chevrolet Silverado 1500 | 1,098 | Service brakes (349) |
| 82 | 2016 Ford Escape | 1,091 | Power train (307) |
| 83 | 2012 Dodge Dart | 1,081 | Power train (446) |
| 84 | 2019 Honda CR-V | 1,081 | Forward collision avoidance, automatic emergency braking (255) |
| 85 | 2017 Hyundai Tucson | 1,081 | Engine (591) |
| 86 | 2016 Honda Civic | 1,073 | Steering (435) |
| 87 | 2015 Ford Escape | 1,068 | Power train (268) |
| 88 | 2021 Tesla Model Y | 1,059 | Forward collision avoidance, adaptive cruise control (406) |
| 89 | 2019 Chevrolet Silverado 1500 | 1,058 | Engine (355) |
| 90 | 2019 Subaru Outback | 1,032 | Electrical system (353) |
| 91 | 2015 Ford Focus | 1,015 | Power train (517) |
| 92 | 2015 Kia Optima | 1,006 | Engine (620) |
| 93 | 2018 Tesla Model 3 | 1,005 | Suspension (176) |
| 94 | 2010 Mercury Milan | 1,001 | Steering (245) |
| 95 | 2016 Dodge Grand Caravan | 998 | Electrical system (310) |
| 96 | 2015 Ford Fusion | 990 | Engine (269) |
| 97 | 2010 Dodge Journey | 988 | Electrical system (577) |
| 98 | 2021 Ford F-150 | 985 | Power train (296) |
| 99 | 2014 Kia Sorento | 982 | Engine (385) |
| 100 | 2013 Kia Sorento | 980 | Engine (496) |
Source: NHTSA consumer complaints bulk file dated 2026-08-25, counted once per vehicle by Oil & Miles. Counts of reports, not rates.
The full top 100 is also in the edition's data file. Look any vehicle up, with every component, in the complaints decoder.
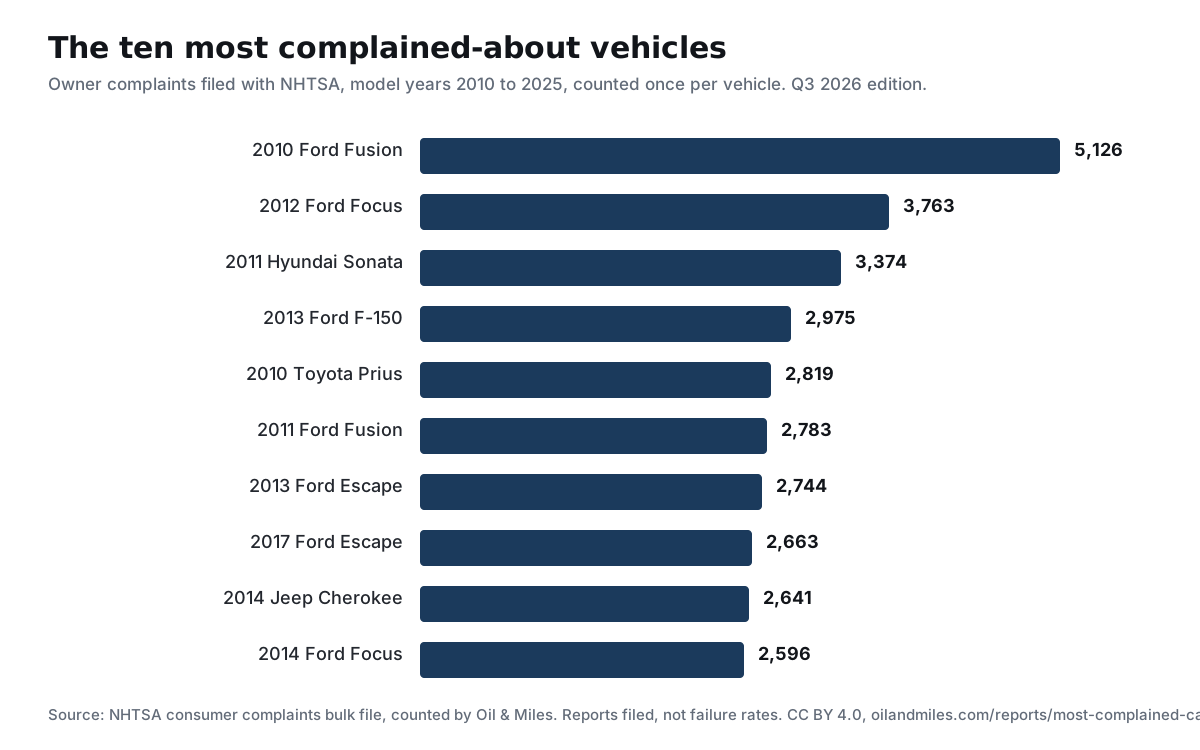
Use this image
Free to republish under CC BY 4.0: credit Oil & Miles and link to this page. The snippet does both.
<a href="https://oilandmiles.com/reports/most-complained-cars"><img src="https://oilandmiles.com/assets/img/charts/most-complained-2026-q3.svg" alt="Horizontal bar chart of the ten vehicles with the most NHTSA complaints, model years 2010 to 2025, led by the 2010 Ford Fusion with 5,126" width="1200" height="750"></a> <p>Diagram: <a href="https://oilandmiles.com/reports/most-complained-cars">Oil & Miles</a>, CC BY 4.0</p>Makes, by share of all complaints
Share of the 626,070 complaints in the file. A make that sells more cars files more complaints; this is volume as much as anything.
| Make | Complaints | Share |
|---|---|---|
| Ford | 130,217 | 20.8% |
| Chevrolet | 57,938 | 9.3% |
| Honda | 45,995 | 7.3% |
| Jeep | 42,287 | 6.8% |
| Hyundai | 39,777 | 6.4% |
| Toyota | 36,081 | 5.8% |
| Kia | 32,431 | 5.2% |
| Nissan | 29,280 | 4.7% |
| Dodge | 26,944 | 4.3% |
| GMC | 20,371 | 3.3% |
| Ram | 19,583 | 3.1% |
| Subaru | 18,345 | 2.9% |
Source: NHTSA consumer complaints bulk file dated 2026-08-25, counted once per vehicle by Oil & Miles. Counts of reports, not rates.
Use this image
Free to republish under CC BY 4.0: credit Oil & Miles and link to this page. The snippet does both.
<a href="https://oilandmiles.com/reports/most-complained-cars"><img src="https://oilandmiles.com/assets/img/charts/most-complained-2026-q3-makes.svg" alt="Makes by share of NHTSA complaints, model years 2010-2025" width="1200" height="742"></a> <p>Diagram: <a href="https://oilandmiles.com/reports/most-complained-cars">Oil & Miles</a>, CC BY 4.0</p>What owners name most
Share of component mentions across the whole file. One complaint can name more than one component, so these are mentions, not complaints.
Complaints by model year
Older model years have had longer to accumulate filings, and the newest are still filling in; the shape says as much about time as about the cars.
Use this image
Free to republish under CC BY 4.0: credit Oil & Miles and link to this page. The snippet does both.
<a href="https://oilandmiles.com/reports/most-complained-cars"><img src="https://oilandmiles.com/assets/img/charts/most-complained-2026-q3-years.svg" alt="NHTSA complaints by model year, 2010-2025" width="1200" height="520"></a> <p>Diagram: <a href="https://oilandmiles.com/reports/most-complained-cars">Oil & Miles</a>, CC BY 4.0</p>The newest model years with the most complaints
Model years 2023 to 2025 only. These vehicles have had the least time to accumulate reports, which is what makes a high count here worth a look.
Model years 2023 to 2025, ranked by complaints filed so far, with the component named most.
| Vehicle | Complaints | Named most |
|---|---|---|
| 2023 Tesla Model Y | 1,134 | Forward collision avoidance, adaptive cruise control again in 2021 |
| 2023 Fisker Ocean | 883 | Electrical system |
| 2024 Honda Prologue | 817 | Steering |
| 2023 Nissan Rogue | 687 | Engine |
| 2023 Honda HR-V | 684 | Visibility/wiper |
| 2024 Jeep Wrangler | 674 | Engine |
| 2023 Honda CR-V | 512 | Steering |
| 2023 Volkswagen ID.4 | 450 | Electrical system |
| 2023 GMC Sierra 1500 | 435 | Engine |
| 2023 Tesla Model 3 | 415 | Forward collision avoidance, adaptive cruise control |
Source: NHTSA consumer complaints bulk file dated 2026-08-25, counted once per vehicle by Oil & Miles. Counts of reports, not rates.
How this was counted
The source is the bulk file, not the API. NHTSA publishes every consumer complaint as a flat file, FLAT_CMPL, and that's what we read. The copy we counted is dated 2026-08-25. The summary API returns the same records with less detail and a page limit, so the file is the only way to count everything.
One complaint, one vehicle. Each complaint is counted once per make, model and model year, deduplicated on the complaint number. NHTSA files tire complaints twice by design, once against the tire and once against the vehicle, and the dedupe removes that double count.
Ten is the floor. Vehicles with fewer than 10 complaints are left out. Below that a single owner moves the ranking.
Components are mentions. A complaint that names an engine and a fuel system counts once under each, so component totals exceed complaint totals, and "unknown or other" is left out of the "named most" column because nobody can act on it.
What this data can't tell you
It's not a failure rate. The file doesn't know how many of each vehicle were sold, so a car that sold in huge numbers collects more filings than a rare car with a worse record. Divide by sales and the order changes; see the comparison below.
It's not verified. Filing is voluntary and NHTSA doesn't check a complaint before publishing it. A recall, a lawsuit or a news cycle sends owners to the form, and that shows up as a spike that is partly the news and partly the car.
It's not evenly aged. A 2010 model year has had fifteen years to accumulate reports, a 2025 model year one. Comparing counts across model years compares time as much as cars, which is why the newest years get their own table.
It's not a verdict on a part. "Named most" is the component owners mentioned most often, not a diagnosis; a complaint can name several parts, and "unknown or other" is left out of that pick.
It's not complete below ten. Vehicles with fewer than 10 complaints are left out of the ranking, so a rare model with a real problem can be absent here and present in the decoder.
How this compares with other rankings
Other rankings measure different things, so their leaders differ from ours. iSeeCars ranks complaints against vehicles sold, which favors low-volume cars with many filings. Edmunds publishes a monthly complaints report per 100,000 vehicles sold, by make rather than by model. Lemon Law Experts counted complaints per 100,000 sales for model years 2015 to 2026, which puts the Chrysler Town & Country first. CarComplaints.com sets NHTSA filings beside its own reader reports, one page per model year.
This page counts raw filings once per vehicle from the bulk file, model years 2010-2025, with a floor of 10. It says which vehicles owners wrote to the regulator about most, not which failed most often. A rate tells you the odds for one car; a count tells you where the reports pile up. Read the two side by side.
How to cite this
Everything on this page is free to quote and republish under CC BY 4.0: credit Oil & Miles and link here. The citation lines, the JSON, the CSV and the chart files are in Download the data near the top; the chart also carries an embed snippet under "Use this image". Questions about the method go to the contact page; we answer journalists the same day.
Editions and changes
This page always carries the latest edition. Each edition is also kept at its own address for citation: Q3 2026. Corrections are made in place and noted here with the date; none so far.
What changed since the previous edition
This is the first edition, so there's nothing to compare yet. From the next edition on, this section lists which vehicles entered or left the top 25 and which moved most, with the numbers behind each move.
Sources
- NHTSA consumer complaints, FLAT_CMPL bulk file. https://www.nhtsa.gov/nhtsa-datasets-and-apis. Baked to
assets/data/complaint-lookup.jsonbytools/make-complaint-lookup.py, which also serves the complaints decoder; the same file, the same counts.
4,091 vehicles and 626,070 complaints, model years 2010-2025. This page is general information about what owners reported, not advice about a specific car. Rebuilt each quarter; the edition is named in the title.